
Render an indoor floor plan with Leaflet, MapLibre or Mapbox GL JS
You have a floor plan as GeoJSON. This tutorial puts it on a web map over OpenStreetMap, colours each room from its properties, adds room labels and a floor switcher. There are full working examples for Leaflet and MapLibre GL JS, and the changes you need for Mapbox GL JS.
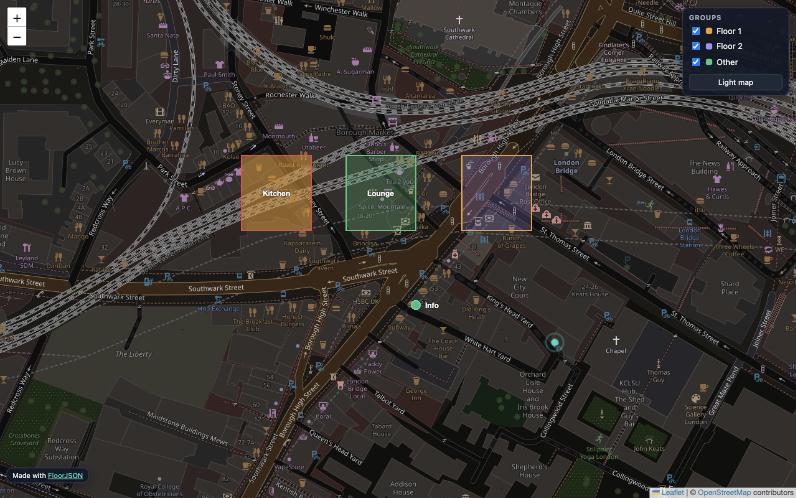
The sample data
Every example reads a file called floorplan.geojson next to the HTML page. Rooms have a level, a fill colour and a label. You can export a file like this from FloorJSON, or use this one:
{
  "type": "FeatureCollection",
  "features": [
    {
      "type": "Feature",
      "properties": { "name": "Kitchen", "label": "Kitchen", "level": 0, "fill": "#f0a020", "stroke": "#ef4444" },
      "geometry": { "type": "Polygon", "coordinates": [[[-0.0915, 51.5050], [-0.0909, 51.5050], [-0.0909, 51.5054], [-0.0915, 51.5054], [-0.0915, 51.5050]]] }
    },
    {
      "type": "Feature",
      "properties": { "name": "Lounge", "label": "Lounge", "level": 0, "fill": "#2ecc78" },
      "geometry": { "type": "Polygon", "coordinates": [[[-0.0906, 51.5050], [-0.0900, 51.5050], [-0.0900, 51.5054], [-0.0906, 51.5054], [-0.0906, 51.5050]]] }
    },
    {
      "type": "Feature",
      "properties": { "name": "Office", "label": "Office", "level": 1, "fill": "#a78bfa" },
      "geometry": { "type": "Polygon", "coordinates": [[[-0.0915, 51.5050], [-0.0900, 51.5050], [-0.0900, 51.5054], [-0.0915, 51.5054], [-0.0915, 51.5050]]] }
    },
    {
      "type": "Feature",
      "properties": { "name": "Entrance", "label": "Entrance", "level": 0, "marker-color": "#34d9c3" },
      "geometry": { "type": "Point", "coordinates": [-0.0907, 51.5049] }
    }
  ]
}fetch() can't read local files opened as file://. Run a tiny local server in the folder, for example npx serve or python3 -m http.server, and open the page from http://localhost.Option A: Leaflet
Leaflet is the lightest choice (about 40 KB) and needs no account or token. The style function reads each room's colours from its properties, and permanent tooltips act as room labels.
<!doctype html>
<html lang="en">
<head>
<meta charset="utf-8">
<meta name="viewport" content="width=device-width, initial-scale=1">
<title>Floor plan</title>
<link rel="stylesheet" href="https://unpkg.com/leaflet@1.9.4/dist/leaflet.css">
<style>
html, body, #map { height: 100%; margin: 0; }
.room-label { background: none; border: none; box-shadow: none; font: 600 12px system-ui, sans-serif;
color: #fff; text-shadow: 0 0 3px #000; }
.room-label::before { display: none; }
#levels { position: absolute; top: 10px; right: 10px; z-index: 1000; display: flex; gap: 4px; }
#levels button { padding: 6px 10px; border: 1px solid #ccc; background: #fff; cursor: pointer; }
#levels button.on { background: #0e5753; color: #fff; }
</style>
</head>
<body>
<div id="map"></div>
<div id="levels"></div>
<script src="https://unpkg.com/leaflet@1.9.4/dist/leaflet.js"></script>
<script>
const map = L.map('map', { maxZoom: 22 });
L.tileLayer('https://tile.openstreetmap.org/{z}/{x}/{y}.png', {
maxZoom: 22, maxNativeZoom: 19, // OSM tiles stop at 19; Leaflet upscales beyond that
attribution: '© OpenStreetMap contributors'
}).addTo(map);
let data, layer;
function showLevel(level) {
if (layer) layer.remove();
layer = L.geoJSON(data, {
filter: f => (f.properties.level ?? 0) === level,
style: f => ({
color: f.properties.stroke || f.properties.fill || '#4f7cff',
weight: f.properties['stroke-width'] ?? 2,
fillColor: f.properties.fill || '#4f7cff',
fillOpacity: f.properties['fill-opacity'] ?? 0.35
}),
pointToLayer: (f, latlng) => L.circleMarker(latlng, {
radius: 7, color: '#fff', weight: 2,
fillColor: f.properties['marker-color'] || '#34d9c3', fillOpacity: 1
}),
onEachFeature: (f, l) => {
if (f.properties.label) {
l.bindTooltip(f.properties.label, {
permanent: true, className: 'room-label',
direction: f.geometry.type === 'Point' ? 'right' : 'center'
});
}
l.bindPopup(`<b>${f.properties.name ?? ''}</b>`);
}
}).addTo(map);
document.querySelectorAll('#levels button')
.forEach(b => b.classList.toggle('on', +b.dataset.level === level));
}
fetch('floorplan.geojson').then(r => r.json()).then(json => {
data = json;
const levels = [...new Set(data.features.map(f => f.properties.level ?? 0))].sort((a, b) => a - b);
document.getElementById('levels').innerHTML =
levels.map(l => `<button data-level="${l}">Floor ${l}</button>`).join('');
document.querySelectorAll('#levels button')
.forEach(b => b.onclick = () => showLevel(+b.dataset.level));
map.fitBounds(L.geoJSON(data).getBounds(), { padding: [30, 30] });
showLevel(levels[0]);
});
</script>
</body>
</html>Option B: MapLibre GL JS (vector, free, no token)
MapLibre GL JS is the open-source fork of Mapbox GL JS. It renders with WebGL, so it stays smooth with thousands of rooms, supports tilt and rotation, and can extrude rooms into 3D. Styling is done with expressions that read properties directly.
<!doctype html>
<html lang="en">
<head>
<meta charset="utf-8">
<meta name="viewport" content="width=device-width, initial-scale=1">
<title>Floor plan</title>
<link rel="stylesheet" href="https://unpkg.com/maplibre-gl@4.7.1/dist/maplibre-gl.css">
<style>html, body, #map { height: 100%; margin: 0; }</style>
</head>
<body>
<div id="map"></div>
<script src="https://unpkg.com/maplibre-gl@4.7.1/dist/maplibre-gl.js"></script>
<script>
const map = new maplibregl.Map({
container: 'map',
style: {
version: 8,
glyphs: 'https://demotiles.maplibre.org/font/{fontstack}/{range}.pbf',
sources: {
osm: {
type: 'raster', tileSize: 256, maxzoom: 19,
tiles: ['https://tile.openstreetmap.org/{z}/{x}/{y}.png'],
attribution: '© OpenStreetMap contributors'
}
},
layers: [{ id: 'osm', type: 'raster', source: 'osm' }]
},
center: [-0.0907, 51.5052],
zoom: 18,
maxZoom: 22
});
const isArea = ['match', ['geometry-type'], ['Polygon', 'MultiPolygon'], true, false];
const isPoint = ['==', ['geometry-type'], 'Point'];
map.on('load', async () => {
const data = await (await fetch('floorplan.geojson')).json();
map.addSource('plan', { type: 'geojson', data });
map.addLayer({ id: 'rooms-fill', type: 'fill', source: 'plan', filter: isArea, paint: {
'fill-color': ['coalesce', ['get', 'fill'], '#4f7cff'],
'fill-opacity': ['coalesce', ['get', 'fill-opacity'], 0.35]
}});
map.addLayer({ id: 'rooms-line', type: 'line', source: 'plan', filter: isArea, paint: {
'line-color': ['coalesce', ['get', 'stroke'], ['get', 'fill'], '#4f7cff'],
'line-width': ['coalesce', ['get', 'stroke-width'], 2]
}});
map.addLayer({ id: 'points', type: 'circle', source: 'plan', filter: isPoint, paint: {
'circle-radius': 7,
'circle-color': ['coalesce', ['get', 'marker-color'], '#34d9c3'],
'circle-stroke-color': '#ffffff',
'circle-stroke-width': 2
}});
map.addLayer({ id: 'labels', type: 'symbol', source: 'plan', filter: ['has', 'label'], layout: {
'text-field': ['get', 'label'],
'text-font': ['Open Sans Semibold'],
'text-size': 13
}, paint: { 'text-color': '#ffffff', 'text-halo-color': '#000000', 'text-halo-width': 1.2 }});
// Show one floor at a time
window.showLevel = level => {
const onLevel = ['==', ['coalesce', ['get', 'level'], 0], level];
map.setFilter('rooms-fill', ['all', isArea, onLevel]);
map.setFilter('rooms-line', ['all', isArea, onLevel]);
map.setFilter('points', ['all', isPoint, onLevel]);
map.setFilter('labels', ['all', ['has', 'label'], onLevel]);
};
showLevel(0);
});
</script>
</body>
</html>Bonus: extrude rooms into 3D
Add this layer inside the load handler to stack floors in 3D. Each level is 3.5 m tall and each room 3 m high. Then tilt the map with map.setPitch(55).
map.addLayer({ id: 'rooms-3d', type: 'fill-extrusion', source: 'plan', filter: isArea, paint: {
  'fill-extrusion-color': ['coalesce', ['get', 'fill'], '#4f7cff'],
  'fill-extrusion-base':   ['*', ['coalesce', ['get', 'level'], 0], 3.5],
  'fill-extrusion-height': ['+', ['*', ['coalesce', ['get', 'level'], 0], 3.5], 3],
  'fill-extrusion-opacity': 0.85
}});
map.setPitch(55);
Option C: Mapbox GL JS
Mapbox GL JS uses the same layer and expression syntax as the MapLibre example. You only change the library, the namespace, the token and the style:
// 1. Load Mapbox GL JS instead of MapLibre:
//    https://api.mapbox.com/mapbox-gl-js/v3.7.0/mapbox-gl.js  (+ mapbox-gl.css)
mapboxgl.accessToken = 'YOUR_MAPBOX_PUBLIC_TOKEN';

const map = new mapboxgl.Map({
  container: 'map',
  style: 'mapbox://styles/mapbox/dark-v11',   // Mapbox styles include fonts
  center: [-0.0907, 51.5052],
  zoom: 18
});

// 2. In the labels layer, use a font that the Mapbox style provides:
//    'text-font': ['DIN Pro Medium', 'Arial Unicode MS Regular']
// Every other addSource / addLayer / setFilter call stays the same.Which library should you choose?
| Leaflet | MapLibre GL JS | Mapbox GL JS | |
|---|---|---|---|
| Cost and account | Free, no account | Free, no account | Token required; free tier, then paid |
| Rendering | SVG or Canvas | WebGL | WebGL |
| Thousands of rooms | Gets slow | Smooth | Smooth |
| 3D extrusion and tilt | No | Yes | Yes |
| Learning curve | Easiest | Moderate | Moderate |
Tips for indoor maps
- Zoom past the tiles. OpenStreetMap tiles stop at zoom 19, but rooms need 20–22. Let the library upscale with
maxNativeZoom: 19(Leaflet) ormaxzoom: 19on the raster source (MapLibre). - Respect the tile policy.
tile.openstreetmap.orgis for light use with attribution. For a busy production site, use a commercial tile provider or host your own tiles. - Draw order matters. Add floor outlines first, rooms next, then furniture and points, so small shapes stay clickable.
- No code at all? In FloorJSON, open Preview and choose Download as HTML map. You get a single HTML file with your colours, labels, icons and a group switcher already built in.
FAQ
Can Mapbox GL JS display a floor plan from GeoJSON?
Yes. Add the GeoJSON as a source, then add fill, line and symbol layers that read colours and labels from feature properties. The MapLibre example on this page works in Mapbox with only the library, token and style changed.How do I show only one floor?
Give every feature a level property and filter on it: the filter option in Leaflet's L.geoJSON, or map.setFilter in MapLibre and Mapbox.Why do my room labels not appear in MapLibre?
Symbol layers need a glyphs URL in the style and a font that exists at that URL. The example uses MapLibre's demo glyphs with Open Sans Semibold.Can I put the floor plan on OpenStreetMap?
You can display it on top of OpenStreetMap tiles, as these examples do. Adding it to the OpenStreetMap database itself is different: that needs OSM indoor tagging and must follow OSM's contribution rules.Need the GeoJSON first?
FloorJSON converts an SVG floor plan into GeoJSON with names, groups, colours and labels already in the properties, ready for the code on this page.
Open FloorJSON